
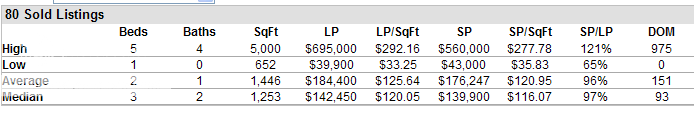
Below are the statistics for the different areas of Big Bear.
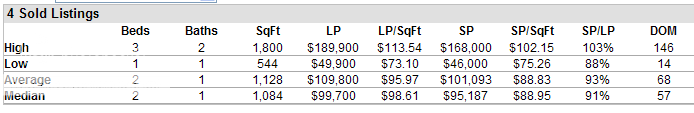
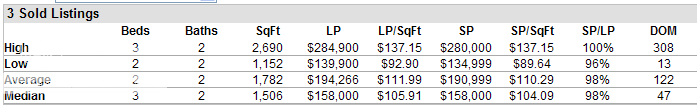
These charts show the information for:
- Average number of bedrooms and baths
- List price
- List price per square foot
- Sold price
- Sold price per square foot
- Price differential (sold price vs list price percentage)
- Days on the market.
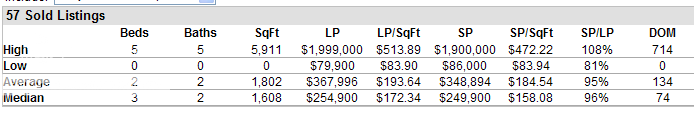
YTD Statistics for Big Bear Lake
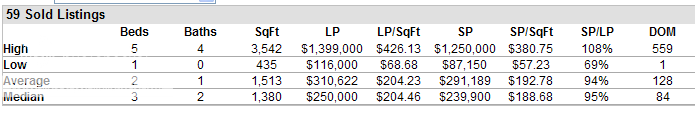
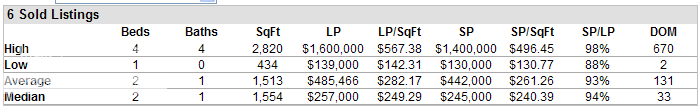
YTD Statistics for the Moonridge Area
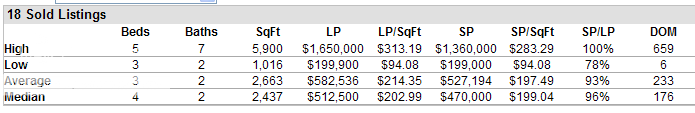
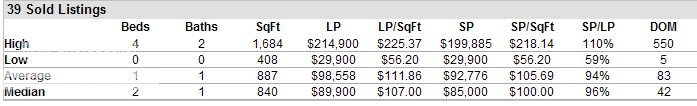
YTD Statistics for Fox Farm Area
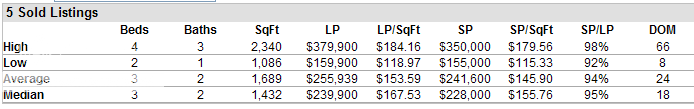
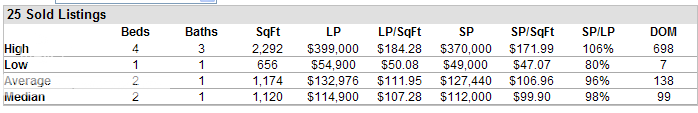
YTD Statistics for Whispering Forest
YTD Statistics for Big Bear City
YTD Statistics for Fawnskin
YTD Statistics for Sugarloaf Area
YTD Statistics for Erwin Lake
YTD Statistics for Baldwin Lake
YTD Statistics for Lake Wiliiams