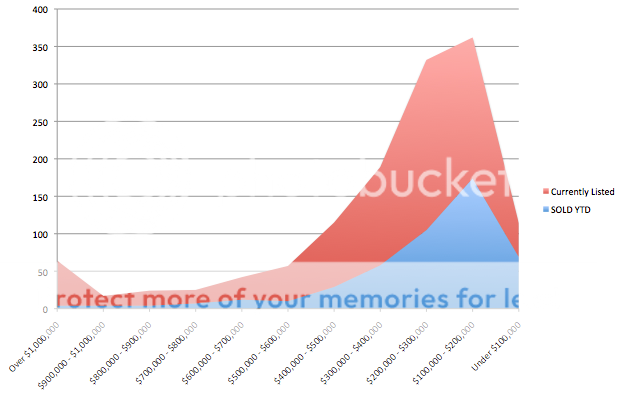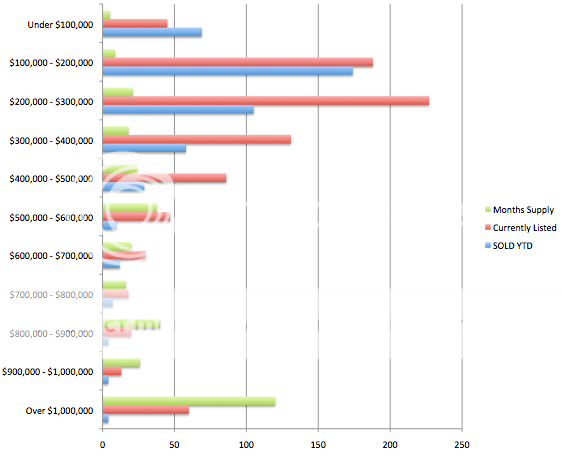

| SOLD YTD | Currently Listed | Months Supply | |
| Over $1,000,000 | 4 | 60 | 120 |
| $900,000 – $1,000,000 | 4 | 13 | 26 |
| $800,000 – $900,000 | 4 | 20 | 40 |
| $700,000 – $800,000 | 7 | 18 | 16 |
| $600,000 – $700,000 | 12 | 30 | 20 |
| $500,000 – $600,000 | 10 | 47 | 37.6 |
| $400,000 – $500,000 | 29 | 86 | 24 |
| $300,000 – $400,000 | 58 | 131 | 18 |
| $200,000 – $300,000 | 105 | 227 | 21 |
| $100,000 – $200,000 | 174 | 188 | 8.6 |
| Under $100,000 | 69 | 45 | 5.2 |
- As expected, homes listed over $1,000,000 in Big Bear are the slowest moving inventory. With over 185 homes currently priced over $800,000 and only 12 closed sales YTD, the high end seller will need to be patient. The average days on the market for these 12 homes is 217.
- 116 homes have sold YTD between $300,000 and $800,000, with 312 on the market in this price range. Average days on the market for this price category is 160.
- 348 homes under $300,000 have closed YTD, with 460 currently available in this price range. Average days on the market for this price category is 107.
- 47% of the total sales YTD were traditional sellers.
- 40% of the total sales YTD were bank owned homes.
- 13% of the total sales YTD were short sales.
